 Find a Solution
The right mix of sales & service in the DNA of telecommunications technicians
PERFORMANCE DNA STUDY:
Picking up Millions of Dollars in Incremental Sales, the Easy Way.
AT A GLANCE
CHALLENGE:
Reduce turnover and at the same time discover why a relatively small number of Technicians consistently ‘punch above their weight’ in terms of production (number of calls) and add-on sales.
SOLUTION:
The company invested in a pDNA study. Using the Profile Sales Assessment to measure the traits of top and bottom producers, we were able to isolate the traits that are most predictive of productivity as well as retention.
The client is a Telecommunications company and business partner to one of the country’s largest cable and media providers. With both Residential and Commercial divisions, their highly trained Technicians install and support sophisticated cable, home phone, high-speed internet and home monitoring systems on behalf of the media provider.
Turnover is a costly problem to the organization. Each new hire undergoes a minimum of eight weeks’ paid technical training before they start in the role, meaning the ‘breakeven’ on the investment in a new front-line employee is in the 6-8 month range. They invest more than $500,000 in this initial training each year and find that fewer than one hire in three is still there at the six month mark, meaning a hard loss in excess of $300K attributable to direct training cost alone.
There is much more to the job, however, than mastering the technology. Techs must have good work habits, so they can operate safely, quickly and cleanly, and be comfortable being up a ladder in all sorts of weather. The very best Technicians are able to build trust and rapport quickly with the customer, and also be on the lookout for opportunities to improve the customer’s experience and consumption of the media company’s products.
In fact, tastefully ‘upselling’ additional products as well as hardware (such as phone jacks, extra lines and cable outlets) is such a large component of the job that the Techs have the potential to earn a substantial amount of commission. In many cases there is no cost to the customer (the Media Partner covers most expenses in the expectation of higher consumption), so the suggestion is generally an easy one to make for the Tech who spies the opportunity.
The right Technician can have an enormous impact on how much additional work is done and on the revenue they generate (ie what the company is able to bill the media partner). Perhaps most important, they hold the reputation of the media partner in their hands – anything less than a positive customer experience will hurt them – and their company.
The Participants
We studied the daily sales activity for a total of 165 Technicians over a six month period, cross-referenced over a 12 month period to expose any anomalies and ensure consistency.
It is a fact of life that not all sales people produce at the same level. The objective of the study was to uncover the differences in ‘hardwiring’ between the most productive and least productive Technicians, and then to project the economic value to the organization of either developing the existing team or ‘screening in’ candidates who have the positive attributes of the top performers, without the liabilities of the poorer performers.
The Study
To identify the extent of the opportunity cost, the first thing we did was analyze aggregate sales performance numbers to break the group into three performance tiers.
To do this we used a technique known as “Utility Analysis”, which separates Technicians into Top, Middle and Bottom Tier performers, using an objective analysis of their sales performance.
We begin the exercise by taking the company’s average daily sales ($79,981) and dividing it roughly into equal thirds. Then we force-rank the individuals in declining order to determine how many of their Techs, working down from the top, it takes to deliver the first third of sales. We keep going down the list to calculate how many more it takes to get the second third… and then the rest make up the final third.
The outcome of that analysis is presented in Table 1:
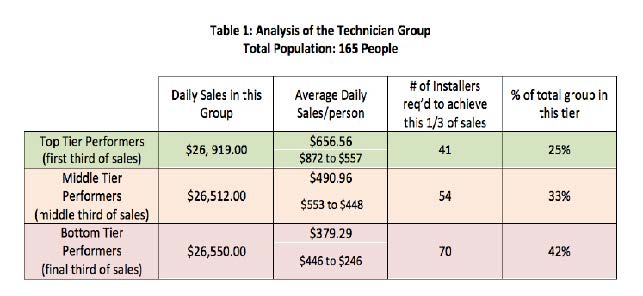
Look at the difference between the three tiers:
- Interesting to note that fully 70 (42%) of their Techs are collectively bringing in the last third of revenue
- The Middle Performers average $111.67 a day more than the Bottom Performers
- The Top Performers average $165.60 a day more than the Middle Performers
- The gap between Top and Bottom is $277.27 per person, per day, every day
What our client realized very quickly was that setting a very conservative target of replacing or moving just 10% of their team up one performance tier (10 bottom to middle, and 5 middle to top) equated to an immediate sales increase of nearly half a million dollars per year, or a 3.4% jump. The full potential is actually much higher than that – but first we had to research the differences in ‘hardwiring’ between the Tiers.
The DNA of Performance
The next step was to uncover the traits and factors that are most predictive of performance – that small handful of items that differentiated top from bottom. For this study, we had 165 Technicians complete the Profiles Sales Assessment – a comprehensive tool that reports on an individual’s make-up across three dimensions – how they learn, think, and use information; their core behavioral traits; and their occupational motivators – the aspects of the work that will be enjoyable and give them energy, vs. those that will just always feel like work to them.
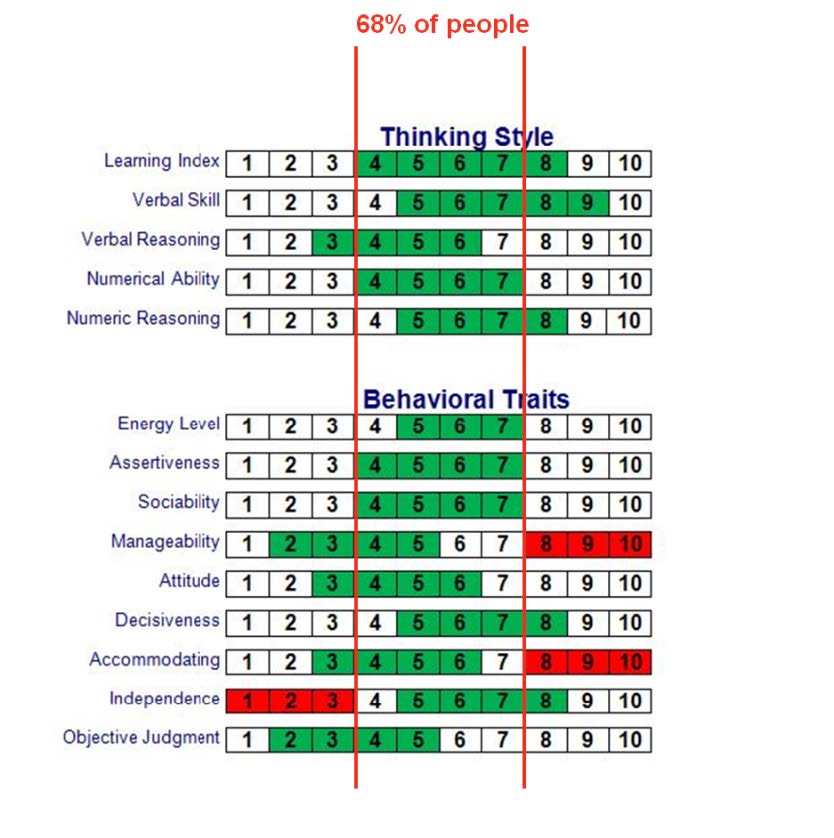
As we pooled the data and overlaid what we knew about each individual’s sales performance, the pattern became clear, quickly. As you will see in the diagram to the right, many traits are shared equally by all the Technicians in the study (these are likely the factors that got them hired, along with their experience). Only three traits are clear differentiators, highly predictive of success in the role. The scores of top performers are in green and those of poor performers in red. The differences are striking.
Key Learning for the Client
There was significant learning for the client across two dimensions – first, the three traits that distinguished top performing Techs from those who do not perform as well; and second, the differences between those who thrive on the Residential side of the business, vs. those who do better on the Commercial side.
They learned that the traits to screen for with all Techs are Manageability, willingness to be Accommodating, and degree of Independence. Specifically,
- Top performers have a work style that emphasizes individualized thinking and a willingness to question inefficient practices. They are less willing than the general population to blindly follow a leader or do the accepted thing.
- Top performers are not concerned with group harmony or being cooperative. They are more tough-minded, willing to disagree with authority while respecting the chain of command.
- Top performers prefer to take responsibility for accomplishing goals autonomously. They are comfortable individual contributors, and slow to seek guidance.
As for the unexpected differences, between the two sides of the business,
- Top performing Commercial Technicians are less manageable, more skeptical and less willing to accept advice than the Residential Technicians – and will need to be managed differently.
- Both positions share an interest in mechanical and enterprising activities. The Commercial Technicians also demonstrate an interest in Financial/Administrative activities while the Residential Technicians are more motivated by (and draw a greater sense of satisfaction from) the technical aspect of the work.
Both sets of insights have allowed the client to dramatically strengthen their selection process, screening for the attributes that have been shown to be predictive of retention and success. They have also rethought their work assignments and career pathing, aligning Technicians with the work that will be the best fit (and most motivating) to them. Finally, their managers now have the tools to communicate with each individual much more effectively, and give them exactly the coaching they need to perform at their best.
One outcome that was not foreseen at the time of the study, is that their Media Partner has realigned their service territories based on the performance metrics of their Installation and Service contractors, and this particular client was awarded the choice territory in the market.
Learning to Measure what Matters on the ‘people’ side of their business has not only given them access to significant revenue they had been leaving on the table; it has also given them a very clear advantage over their competitors.