 Find a Solution
Isolating the DNA of top-producing estimators
PERFORMANCE DNA STUDY: Growing Sales by Learning to Measure What Matters in the PropertyGrowing Sales by Learning to Measure What Matters in the Property Restoration Business.
AT A GLANCE
CHALLENGE:
Investigate why some Estimators consistently out-produce their peers, and why others seem to always struggle.
SOLUTION:
The company invested in a pDNA study. Using the right tools to measure the traits of top and bottom producers, we were able to isolate those traits that are most predictive of performance – as well as those to avoid.
The client is a leader in the Property Restoration and Disaster Recovery business, with franchised locations across the country. These are the people your insurance company would call if your home or business were damaged by a storm, or a flood or a fire.
The insurance company would typically call 3-4 such companies, who would then each dispatch an Estimator to the scene. The job of the Estimator is to meet with the property owner if possible, to establish rapport and start building trust, then to catalog the damage to the premises and to the property contained there and itemize all the work to be done to bring everything back to the way it was.
Estimators must understand all aspects of building and construction; they need to have a keen eye for detail in assessing the damage and quoting the repairs. Missing even a small element in their costing can have a huge impact on gross margin.
In addition to these technical skills, Estimators must be able to build relationships quickly – with the insurance adjusters because that will determine how often they get called (the adjusters are their primary source of leads), and with the homeowner, usually under stressful conditions, because the ultimate decision of who is awarded the work lies in the hands of the homeowner. Finally, there is also considerable opportunity for the Estimator to upsell additional work to the property owner – for example, proposing finishing a basement that was previously unfinished ‘while the place is torn apart anyway’.
The right Estimator can have an enormous impact on how much business is awarded, and on the Gross Margin of that work once it is complete.
The Participants
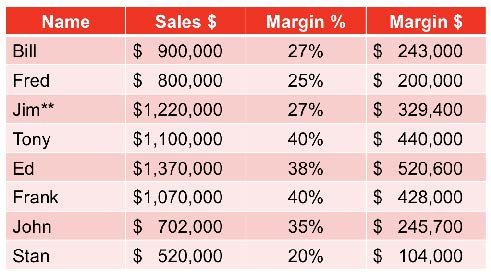
The Company provided us with ten Estimators to study, all working out of a single location and reporting to the same manager, so we could eliminate local culture and management style as variables. Two of them had not been there for a full year, so we segregated them from the rest. The company also provided us with each person’s Sales numbers and Gross Margin percentage over a full year.
They also shared with us that Jim’s sales are overstated because Jim ‘inherited’ a book of business from an individual who had retired through the year; that year’s sales had been exceptionally high for him and they did not know if the performance would repeat.
The Study
The next step was to rank the team. The client asked us to place a priority on Gross Margin Dollars, rather than sales volume, so we resequenced the list in such a way that the top producers were at the top and the weaker producers were at the bottom. The new rankings appear below.
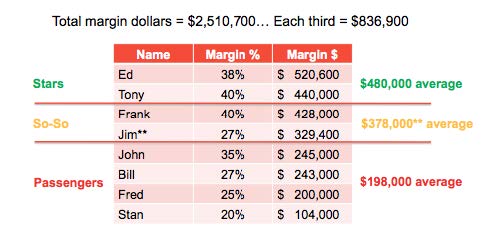
Then we followed a very specific methodology: we took the total GM produced by the group and divided it into three equal thirds. Therefore, Total Margin Dollars for the group was $2,510,700, and each third was worth $836,000.
Our objective was then to see how many salespeople it took, starting from the top of the list and working down, to produce the first third of revenue, then how many to generate the second third, and finally how many brought in the last third.
What we uncovered was that the top two, Ed and Tony, delivered more than a third between them, and actually contributed a little to the second third, brought home by Jim (whose numbers were overstated) and John. What the client had not realized is that fully half their players are pulling in the last third of their gross margin.
Even more compelling are the averages in each tier:
The stars at the top are bringing in an average of $480,000 each, while the laggards at the bottom are bringing in an average of only $198,000 each.
What’s it worth to “get it right”, in this case? About $282,000 in Gross Margin. Per person. Every year.
The DNA of Performance
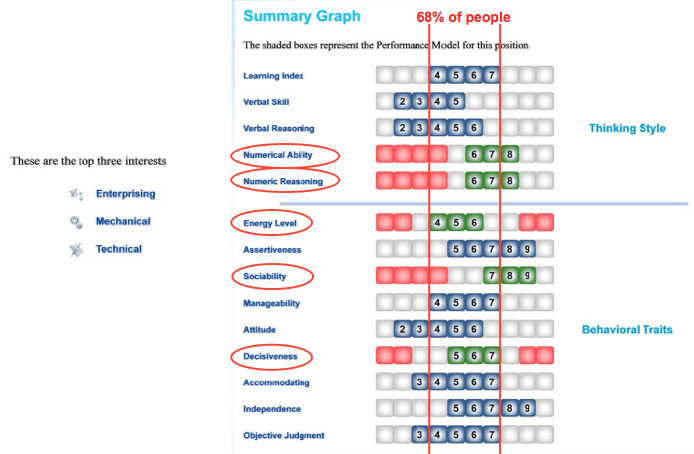
The next step was to uncover the traits and factors that are most predictive of performance – that small handful of items that differentiated top from bottom. For this study, we had all ten Estimators complete the Profiles Sales Assessment – a comprehensive tool that reports on an individual’s hardwiring across three themes – how they learn, think, and use information; their core behavioral traits; and their occupational motivators – the aspects of the work that will be enjoyable and give them energy, vs. those that will just always feel like work to them.
As we pooled the data and overlaid what we knew about each individual’s performance, the pattern became clear, quickly. As you will see in the diagram to the right, many traits are shared equally by all the Estimators in the study (these are likely the factors that got them hired, along with their experience). Only five traits are critical differentiators; you will see the scores of top performers in green and those of weaker performers in red. The differences are striking.
Key Learning for the Client
In this particular role, with this particular client, top performers have to be reasonably good at using numbers to drive at decisions. They will use a direct approach to selling and also appreciate the subtleties of negotiation. They are motivated by personal contact with others. They are good at time management, maintain an even pace, and arrive at thoughtful, balanced decisions relatively quickly. Finally, they enjoy persuading others, enjoy landing the sale, and are highly motivated by recognition.
These were not factors they had been screening for. The emphasis had been on relevant industry experience and the ‘rolodex’, the relationships that they brought with them.
Interestingly, one of their very lowest producers had been the very best producer for years at a competitor; they had enticed him to join them without realizing that the factors that had set the stage for his success there were not present here.
The pDNA study identified for this client those traits that are critical for success, allowing them to better screen – and coach – their Estimators to deliver dramatically higher margin. All they had to do was to learn to measure what matters, using the right tool for the purpose.
QUICK FACTS
$480k the average amount each top performer brought into the company.
$198k the average amount each bottom performer brought into the company.
The right tools to help you measure what matters most in your people”